send link to app
Sentra Lighthouse app for iPhone and iPad
4.2 (
3792 ratings )
Utilities
Developer: Insider Technologies Limited
Free
Current version: 1.0.1, last update: 7 years agoFirst release : 10 Oct 2017
App size: 47.03 Mb
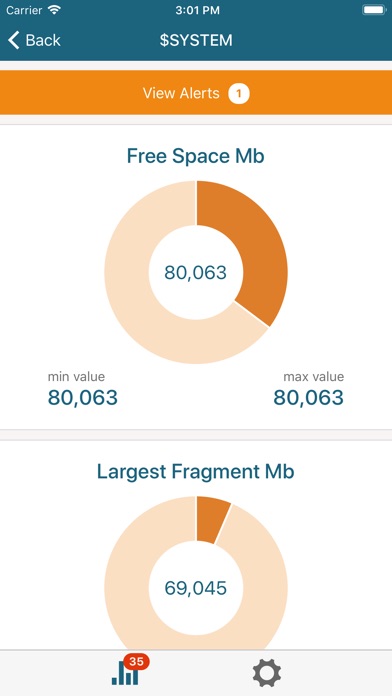
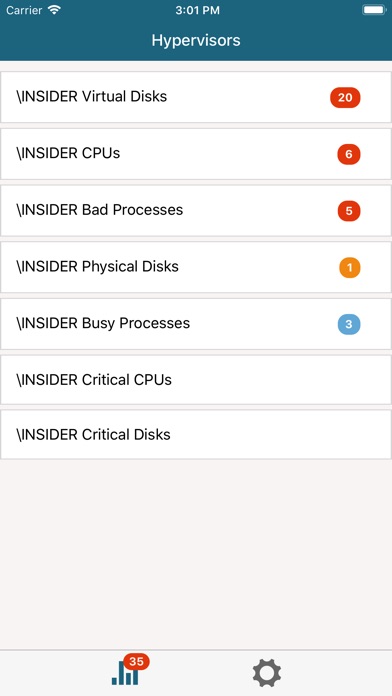
Display metrics and alerts generated by Sentra Lighthouse:
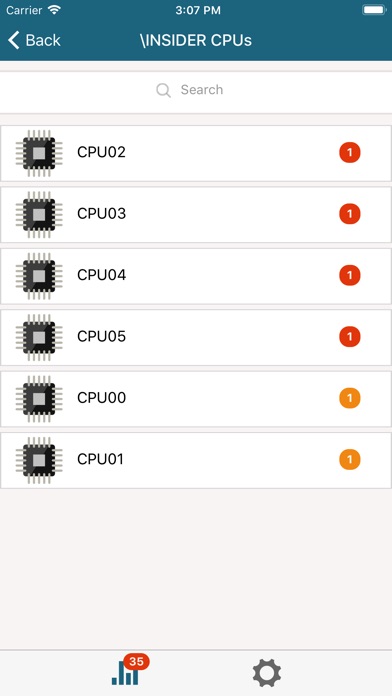
- Shows a graphical display of the health of your NonStop CPU and DISK subsystems.
- Select views of Physical and Virtual disks; Busy Processes and Bad Processes.
- From each item, drill down further to obtain metrics and any associated alerts, which are categorised into severity - Low, Medium, High.
- Receive notifications of any new alerts.


